


Week of July 20, 2026

Published every Monday: Get a detailed snapshot of what moved the markets last week—and what to watch this week.

Improving inflation data is good news—for now.

Despite better-than-expected inflation data, rising oil prices and a technology sell-off dragged down global equity markets. The Nasdaq Composite and S&P 500 led U.S. markets lower. International markets also declined, with emerging markets falling more than 3 percent. Core bonds and Treasuries were higher.

Weekly Quick Hits

Beyond the Headlines

Improving inflation data is good news—for now.

Report Releases

Data showed better-than-expected inflation and continued retail sales growth.

Financial Market Data

Global stocks declined across the board, led by a technology sell-off.

Looking Ahead

With few economic reports this week, earnings take center stage.

BEYOND THE HEADLINES:

Improving inflation data is good news—for now.

In the biggest drop since April 2020, consumer prices declined last month after spiking in prior months. Lower oil prices were an important driver of the better-than-expected inflation data, but declines were broad-ranging across several categories.

Any improvement in prices is certainly positive for consumers. Retail sales continued to move higher, with June marking the fifth consecutive month of gains. A strong consumer is key to a solid economy. Concerns that could affect the path of inflation remain, however, and should continue to be monitored.

Producer Prices Tell a Mixed Story
Producer prices also declined last month due to the sharp drop in oil prices. But excluding food and energy, producer prices increased slightly. That could mean higher prices for core goods. Further complicating the matter is that military action in the Middle East has escalated recently, calling into question whether a deal to end the war and reopen the Strait of Hormuz can be reached. Oil prices have moved from less than $69 per barrel around Independence Day to more than $80 today. If oil prices remain at these levels, they are likely to push inflation higher across the supply chain.

Fed Chair Confirms Inflation Remains the Focus
In recent testimony before Congress, Federal Reserve (Fed) Chair Kevin Warsh reiterated the central bank’s commitment to taming inflation. He said the committee has no tolerance for higher prices and that it will bring them down. When asked how he defined price stability, Warsh replied that it is price increases that households and businesses “don’t have to think about.” That is certainly not the landscape the Fed is dealing with today. If the Fed can achieve its goal, however, doing so should bring relief to consumers and increase purchasing power—though that is likely to take time.

Fundamentals Should Support the Market
Stock markets have drifted lower recently. Given market appreciation since April, a pullback is unsurprising. Despite concerns about rising oil prices and their impact on inflation data—and whether the Fed will raise rates as a result—fundamentals remain solid and should provide a decent backdrop for equities.

It’s very early in second-quarter earnings season, with only about 10 percent of S&P 500 companies having reported. The early returns have again been positive. According to FactSet, 88 percent of companies that have reported have beaten consensus expectations. These expectations were already elevated, with analysts forecasting earnings growth of 22 percent. Although volatility is likely to persist until there is more clarity on the war in the Middle East, strong fundamentals indicate a healthy market backdrop.


“Oil prices have moved from less than $69 per barrel around Independence Day to more than $80 today. If oil prices remain at these levels, they are likely to push infaltion higher across the supply chain

Report Releases: July 13–17, 2026

Consumer Price Index (CPI):
June (Tuesday)

Consumer inflation slowed more than expected last month, due in large part to falling energy prices. Despite the drop in headline inflation, core prices were flat.

  • Prior monthly CPI/core CPI growth: +0.5%/+0.2%
  • Expected monthly CPI/core CPI growth: –0.1%/+0.2%
  • Actual monthly CPI/core CPI growth: –0.4%/+0.0%
  • Prior year-over-year CPI/core CPI growth: +4.2%/+2.9%
  • Expected year-over-year CPI/core CPI growth: +3.8%/+2.8%
  • Actual year-over-year CPI/core CPI growth: +3.5%/+2.6%

Producer Price Index (PPI):
June (Wednesday)

Producer price growth also came in below economist estimates last month. Although inflation remains well above the Fed’s 2 percent target, last month’s reports were an encouraging step in the right direction.

  • Prior monthly PPI/core PPI growth: +0.6%/+0.1%
  • Expected monthly PPI/core PPI growth: +0.0%/+0.3%
  • Actual monthly PPI/core PPI growth: –0.3%/+0.2%
  • Prior year-over-year PPI/core PPI growth: +6.0%/+4.6%
  • Expected year-over-year PPI/core PPI growth: +6.2%/+5.1%
  • Actual year-over-year PPI/core PPI growth: +5.5%/+4.7%

Retail Sales:
June (Thursday)

Retail sales growth slowed last month, with core sales missing expectations. This marks five consecutive months of sales growth.

  • Expected/prior monthly retail sales change: +0.2%/+1.0%
  • Actual monthly retail sales change: +0.2%

Preliminary University of Michigan Consumer Sentiment Survey:
July (Friday)

Consumer sentiment improved more than expected to start July, due in part to better expectations for future economic conditions amid declining oil prices.

  • Expected/prior consumer sentiment: 51.0/49.5
  • Actual consumer sentiment: 54.4


The Takeaway


  • Improving inflation data and five consecutive months of retail sales growth provided positive signs for the U.S. economy.
  • The University of Michigan consumer sentiment survey showed that consumers were more optimistic about the future.

Financial Market Data

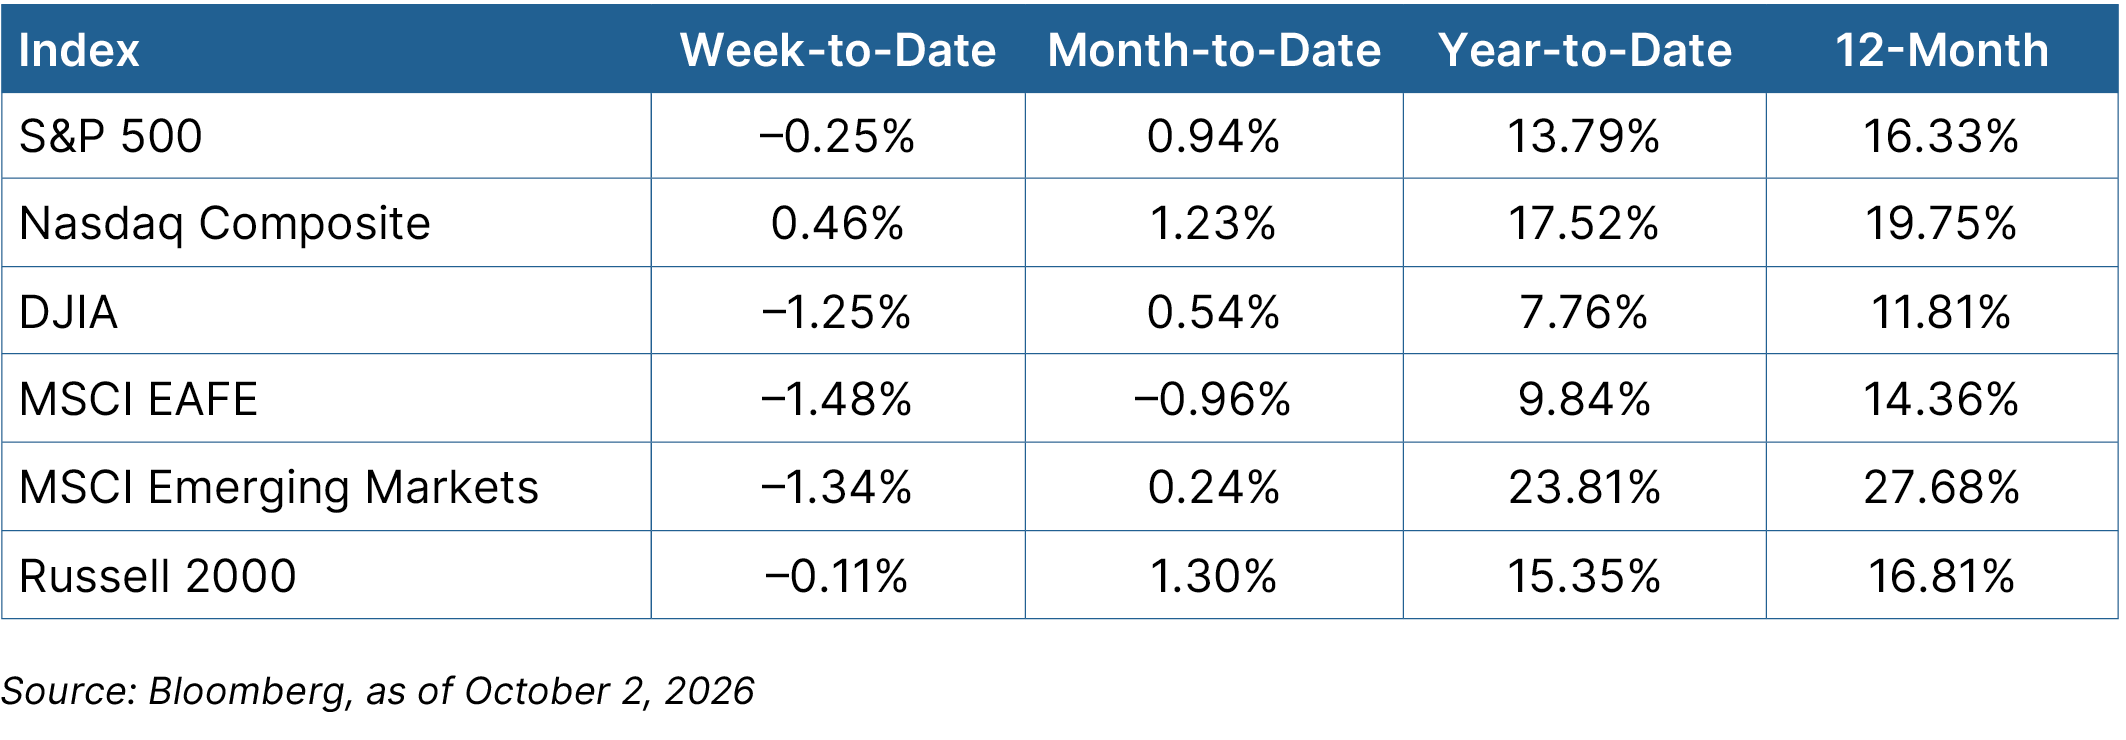
Equity

A sell-off in technology and AI stocks dragged down global markets. The Nasdaq Composite and the S&P 500—down almost 3 percent and 1.5 percent, respectively—led U.S. markets lower. The Dow Jones Industrial Average and the Russell 2000 each declined less than 1 percent. With oil prices rising nearly 15 percent, energy was the best-performing sector, rising nearly 5 percent. Technology (down 3.8 percent) and communication services (down 2.4 percent) were the weakest sectors. International markets were also lower, with developed markets down less than 1 percent and emerging markets down more than 4 percent.

Equity graph

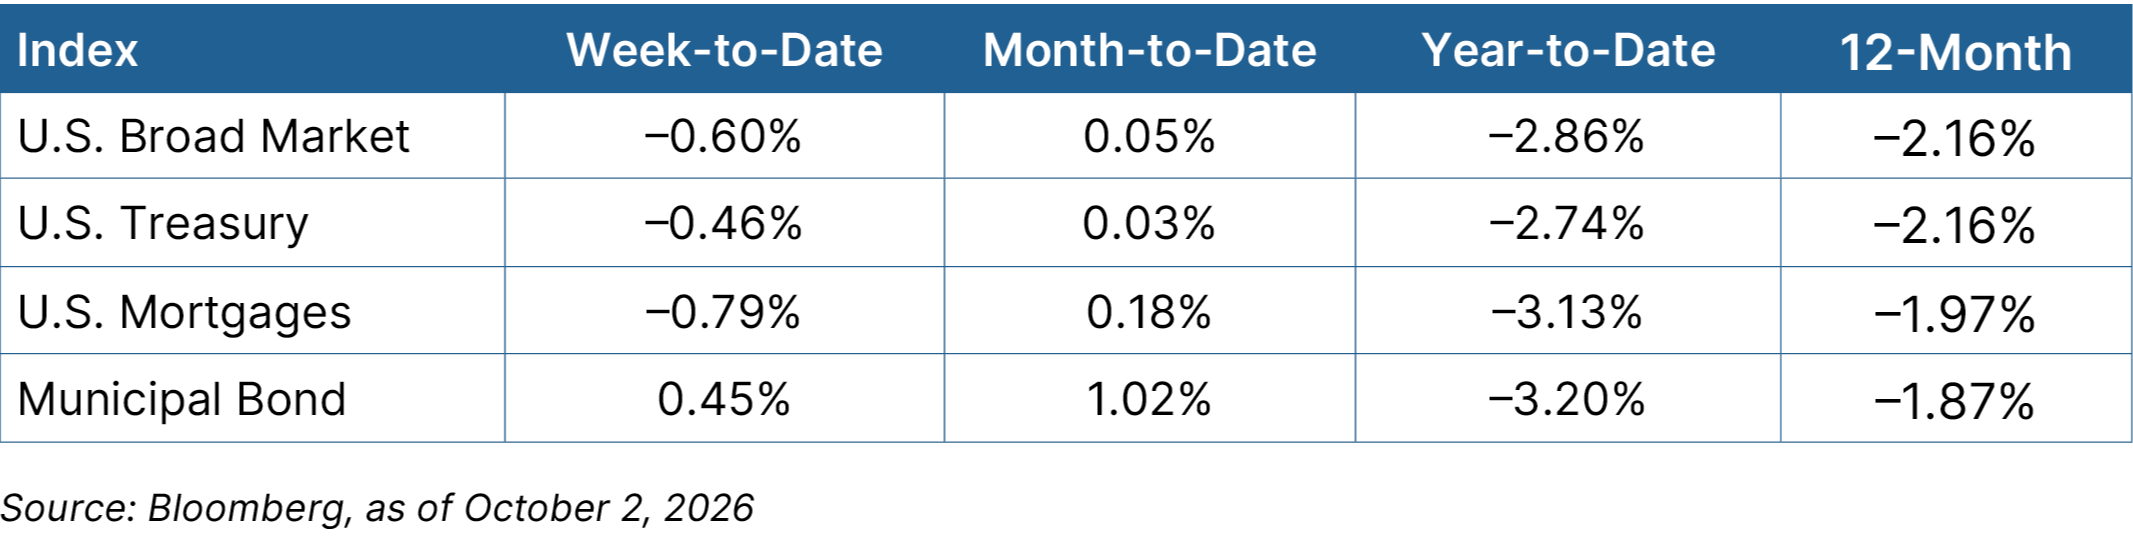
Fixed Income

Improving inflation readings and a weak stock market provided a positive backdrop for fixed income investors. Core bonds and Treasuries moved marginally higher. The 10-year Treasury yield closed essentially unchanged at 4.57 percent. Municipal markets were lower but declined only 0.4 percent.

Fixed Income graph

The Takeaway


  • A technology sell-off pulled global equity markets down. Domestically, the Nasdaq Composite and S&P 500 declined the most. International stocks were also down.
  • Fixed income markets were mixed, with core bonds and Treasuries marginally higher.
Looking Ahead Image

Looking Ahead

With no major economic reports scheduled this week, investors will shift their focus elsewhere. Updates from the Middle East that could affect the Strait of Hormuz and oil prices will be critical. Second-quarter earnings reports will begin to accelerate.

  • Investors will watch second-quarter earnings updates from Alphabet, Tesla, and Intel.

Disclosure: This material is intended for informational/educational purposes only and should not be construed as investment advice, a solicitation, or a recommendation to buy or sell any security or investment product. Diversification does not assure a profit or protect against loss in declining markets, and diversification cannot guarantee that any objective or goal will be achieved. Please contact your financial professional for more information specific to your situation.

Bonds are subject to availability and market conditions; some have call features that may affect income. Bond prices and yields are inversely related: when the price goes up, the yield goes down, and vice versa. Market risk is a consideration if sold or redeemed prior to maturity.

Certain sections of this commentary contain forward-looking statements that are based on our reasonable expectations, estimates, projections, and assumptions. Forward-looking statements are not guarantees of future performance and involve certain risks and uncertainties, which are difficult to predict. All indices are unmanaged and are not available for direct investment by the public. Past performance is not indicative of future results. The S&P 500 is based on the average performance of the 500 industrial stocks monitored by Standard & Poor’s. The Nasdaq Composite Index measures the performance of all issues listed in the Nasdaq Stock Market, except for rights, warrants, units, and convertible debentures. The Dow Jones Industrial Average is computed by summing the prices of the stocks of 30 large companies and then dividing that total by an adjusted value, one which has been adjusted over the years to account for the effects of stock splits on the prices of the 30 companies. Dividends are reinvested to reflect the actual performance of the underlying securities. The MSCI EAFE Index is a float-adjusted market capitalization index designed to measure developed market equity performance, excluding the U.S. and Canada. The MSCI Emerging Markets Index is a market capitalization-weighted index composed of companies representative of the market structure of 26 emerging market countries in Europe, Latin America, and the Pacific Basin. The Russell 2000® Index measures the performance of the 2,000 smallest companies in the Russell 3000® Index. The Bloomberg US Aggregate Bond Index is an unmanaged market value-weighted performance benchmark for investment-grade fixed-rate debt issues, including government, corporate, asset-backed, and mortgage-backed securities with maturities of at least one year. The U.S. Treasury Index is based on the auctions of U.S. Treasury bills, or on the U.S. Treasury’s daily yield curve. The Bloomberg US Mortgage Backed Securities (MBS) Index is an unmanaged market value-weighted index of 15- and 30-year fixed-rate securities backed by mortgage pools of the Government National Mortgage Association (GNMA), Federal National Mortgage Association (Fannie Mae), and the Federal Home Loan Mortgage Corporation (FHLMC), and balloon mortgages with fixed-rate coupons. The Bloomberg US Municipal Index includes investment-grade, tax-exempt, and fixed-rate bonds with long-term maturities (greater than 2 years) selected from issues larger than $50 million. One basis point is equal to 1/100th of 1 percent, or 0.01 percent.

Authored by the Investment Research team at Commonwealth Financial Network®.

© 2026 Commonwealth Financial Network®

Let’s Talk About Your Financial Future

Whether you’re navigating a volatile market or preparing for the future, we’re here to help.

Schedule a Consultation